
In this guide, we will see how to pull official exchange rates directly into Power BI from the Global Exchange Rates API. These rates come from trusted sources such as central banks and are suitable for accounting, regulatory reporting, and internal dashboards.
1Open Power BI Desktop
Create a new report.
2Connect to the data source
Go to Home → Get Data → Web

In the URL field, enter:
https://api.globalexchangerates.org/v1/latest?subscription-key=YOUR_API_KEY
Optionally you can also specify a base currency or a specific provider, for example for the ECB (European Central Bank):
https://api.globalexchangerates.org/v1/latest?subscription-key=YOUR_API_KEY&provider=ECB
Click OK to proceed.
3Transform the Response
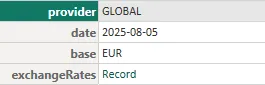
We will need to transform the response as a flat table, starting from the Source select the exchangeRates record.
This will output the exchange rates as a key-value pair list.
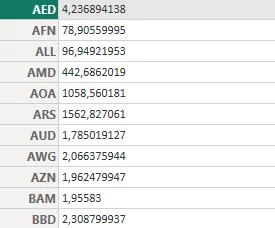
In the ribbon, choose the To Table action from the Conversion tab.
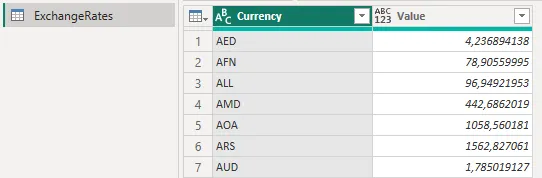
This will generate a table with our exchange rates, we can now rename the column Name in Currency
Conclusions
We now have a table with the most recent exchange rates by official central banks, and we can use these for example to:
- Create a calculated column to convert each value into the desired currency.
- Join the rates table to the transaction data using the currency code
It is also possible to:
- Schedule refreshes in the Power BI Service to pull updated exchange rates daily
- Use the
/historicalendpoint to fetch exchange rates by date.
Related guides: Official exchange rates in Google Sheets, in Excel, in Looker Studio.